Operational reporting · case study
A production schedule built for the morning planning decision.
Production teams can see what is late, what is due next, and where active work stands without rebuilding the schedule in a spreadsheet.
Completed as part of Data Graphics' internal production workflow.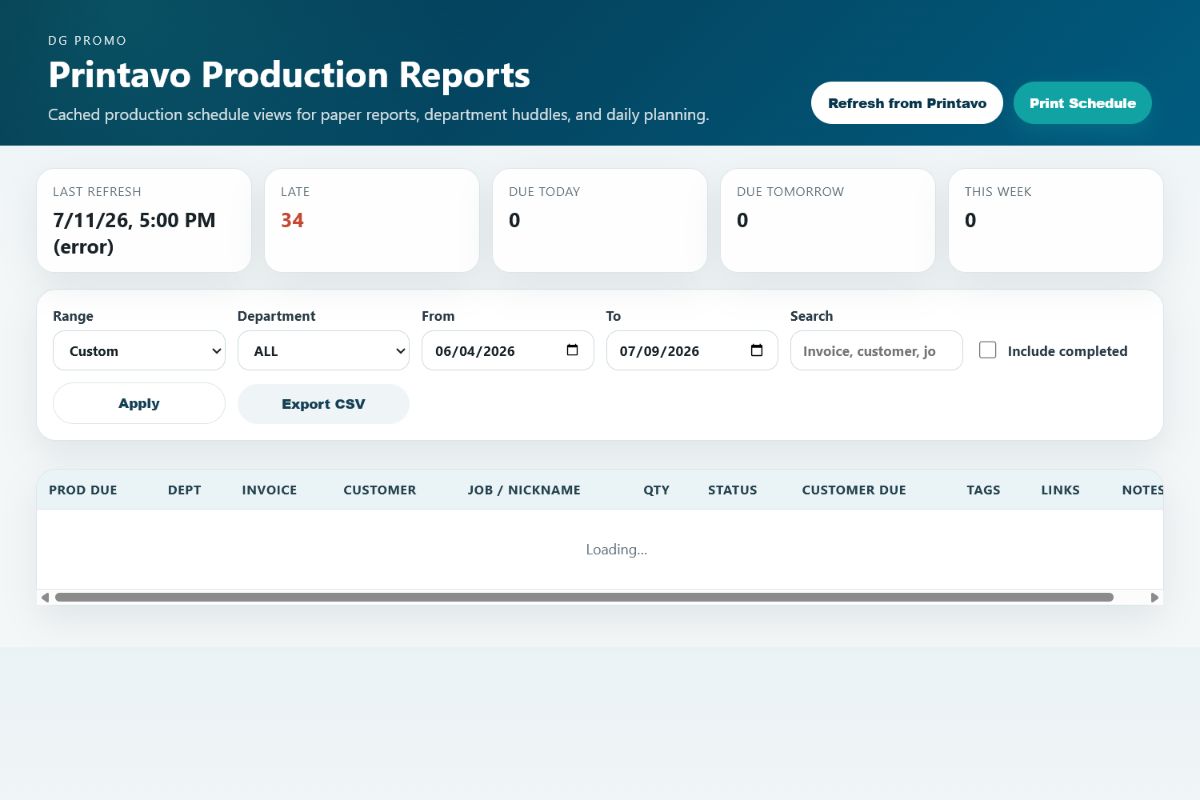
Public interface view captured July 11, 2026. Customer rows were not included in the capture.
Context and problem
Daily planning depended on seeing the same schedule from several angles.
Production work moves through departments with different due dates, quantities, statuses, tags, links, and notes. A useful view has to answer what is late, what is due, where the work sits, and what deserves attention without turning the morning huddle into a spreadsheet exercise.
What the project brought together
The work mapped the daily review, made the reporting interface responsive, added date and department filtering, exposed searchable work orders and completed-work controls, and kept CSV export and data refresh available during the planning review.
How the system works
- 01Source
Production schedule data is retrieved from the existing operating source.
- 02Normalize
Dates, departments, statuses, quantities, notes, and links are shaped into a consistent record.
- 03Review
Teams filter the schedule by department and date, then search for the work order that needs attention.
- 04Act
The team can plan the next run, follow up on an exception, export the schedule, or refresh the data.
Result
Production teams can review late work, upcoming due dates, department status, and active exceptions in one schedule.
Next opportunity
Add documented refresh health, stronger empty and error receipts, and a reviewed mobile summary if the daily operating workflow calls for it.
Discuss a related project